Today I will show how to use a graphical GUI to trace the execution of your Database connection pool running in JBoss AS or WildFly with ton of useful info at your hands.
There are already some nice tools to monitor the execution of your database activity like P6Spy or og4jdbc. However all these nice tools are lacking (at least the last time I’ve checked them!) some nice GUI interface which can easily let you monitor, sort, filter and easily pinpoint the critical execution paths on your database statements.
Now I’ll show you a nice tool that can do this, and also it’s free! This framework has been developed by sylvain laurent and it’s available on: https://github.com/sylvainlaurent/JDBC-Performance-Logger
You can either pickup the source code or if you are in an hurry (as I am!) you can go for the binaries at: https://github.com/sylvainlaurent/JDBC-Performance-Logger/releases
So, basically you have to install the JDBC Driver on the application server. This driver acts as a bridge towards the real driver so that the information can be sent via sockets on port 4561. The performance JDBC driver is able to reach the real database as it contains the Connection URL of the real database, prefixed by jdbcperflogger:
So for example, if you are going to connect to an Oracle database available at the URL jdbc:oracle:thin:@host:1521:orcl, then you have to set as JDBC Driver URL:
jdbcperflogger:jdbc:oracle:thin:@host:1521:orcl
Now let’s see in practice how to use it to trace the execution of the H2 ExampleDS Datasource.
Step #1 Since the JDBC Performance Driver will need to access the real Driver class, we need to make available the com.h2database.h2 module (which contains the H2 Driver). The simplest way to do it, is to make globally available it through the “ee” subsystem. From the CLI execute:
/subsystem=ee:write-attribute(name="global-modules",value=[{"name" => "com.h2database.h2 module","slot" => "main"}])
(PS the above step is much easier with the Web console Subsystem | Container | EE | Add )
Step #2 Deploy the JDBC Perf Driver
deploy jdbc-perf-logger-driver-0.7.3.jar
Step #3 Install the datasource pointing to the Driver
data-source add --name=TraceJDBC --driver-class=ch.sla.jdbcperflogger.driver.WrappingDriver --driver-name=jdbc-perf-logger-driver-
0.7.3.jar --connection-url=jdbcperflogger:jdbc:h2:mem:test;DB_CLOSE_DELAY=-1;DB_CLOSE_ON_EXIT=FALSE --user-name=sa --password=sa --jndi-name=java:/tracer
Now the JDBCPerformance Driver will tunnel the db calls to jdbc:h2:mem:test database using the JNDI binding java:/tracer
Step #4 Adjust your applications to use the java:/tracer binding
For example, in an application using persistence.xml to access the H2 datasource:
<?xml version="1.0" encoding="UTF-8"?>
<persistence xmlns="http://java.sun.com/xml/ns/persistence" xmlns:xsi="http://www.w3.org/2001/XMLSchema-instance" version="2.0" xsi:schemaLocation="http://java.sun.com/xml/ns/persistence http://java.sun.com/xml/ns/persistence/persistence_2_0.xsd">
   <persistence-unit name="persistenceUnit" transaction-type="JTA">
      <provider>org.hibernate.ejb.HibernatePersistence</provider>
      <!-- <jta-data-source>java:jboss/datasources/ExampleDS</jta-data-source> -->
      <jta-data-source>java:/tracer</jta-data-source>
      <properties>
         <property name="hibernate.hbm2ddl.auto" value="create" />
      </properties>
   </persistence-unit>
</persistence>
Step #5 Start the GUI tool
From the jdbc-perf-logger-gui-0.7.3\bin folder launch:
jdbc-perf-logger-gui.sh # linux
or
jdbc-perf-logger-gui.bat #windows
Step #6 Play with your application and enjoy the metrics, like fetch time, thread name, number of connections and more!
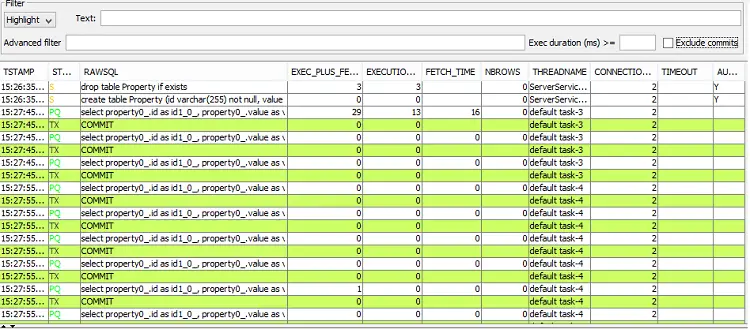
Very cool, isn’t it ?
Thanks to sylvain laurent for providing this framework and documentation to get started with it.
Found the article helpful? if so please follow us on Socials


