Heap dumps are vital for diagnosing memory-related issues in Java applications. Spring Boot Actuator simplifies the process of collecting heap dumps, offering insights into memory usage and aiding in resolving memory-related problems..
Why Collect Heap Dumps with Spring Boot Actuator?
Heap dumps provide a snapshot of the Java Virtual Machine’s (JVM) memory at a given time, showcasing object allocations, memory leaks, and more. Spring Boot Actuator streamlines the heap dump collection process, enabling developers to efficiently diagnose and resolve memory-related issues.
Firstly, make sure that you know how to configure and install Spring Boot 3 Actuator. The following article covers it in detail: Spring Boot 3 Actuator Essentials
How to enable Heap Dump capturing with the Actuator
In order to enable the Spring Boot Actuator, make sure you have the starter available as a dependency:
Then, enable the Thread Dump endpoint, include the following in the application.properties file:
management.endpoints.web.exposure.include=heapdump
Then, send an HTTP GET request to http://localhost:8080/actuator/heapdump using a web browser, cURL, or any HTTP client. For example:
wget -O dump.dmp http://localhost:8080/actuator/heapdump
Heap dumps are binary files that contain detailed information about memory usage, objects, and their relationships. Analyzing these dumps requires specialized tools like Eclipse MAT (Memory Analyzer Tool), VisualVM, or YourKit. These tools enable visualizing memory usage, identifying memory leaks, and optimizing memory utilization.
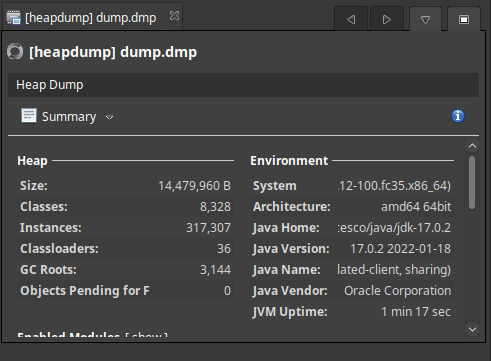
For example, using JVisualVM, head to the option File | Load and load the Heap Dump file.
You should be able to analyze if from the JVisualVM interface:
Since the output is in JSON format, you might want to format it and maybe store it locally as follows:
curl http://localhost:8080/actuator/threaddump | jq > dump.json
If your Heap Dump is extremely large, then this article might be helpful: How to analyze a large Heap dump.
Conclusion:
Spring Boot Actuator provides a convenient endpoint (/actuator/heapdump) to effortlessly collect heap dumps. These dumps offer invaluable insights into memory usage, aiding developers in identifying memory-related issues, optimizing resource consumption, and ensuring the robustness of Java applications. Leveraging Actuator’s heap dump collection enhances the efficiency of memory diagnostics and contributes to the overall stability and performance of applications.


