Thread dumps are essential in diagnosing and resolving performance issues in Java applications. With Spring Boot Actuator, collecting thread dumps becomes a seamless process, offering insights into thread activity for troubleshooting.
Why Collect Thread Dumps with Spring Boot Actuator?
Spring Boot Actuator provides a built-in endpoint for fetching thread dump information. The /actuator/threaddump endpoint simplifies the process of obtaining a thread dump for your Spring Boot application. Thread dumps offer a snapshot of thread states, stack traces, and valuable information on thread activity, aiding in pinpointing performance bottlenecks and debugging issues.
Firstly, make sure that you know the basics of Spring Boot Actuator. Read this article to know more about it: Spring Boot 3 Actuator Essentials
Enabling Spring Boot Thread Dump Actuator
In order to enable the Spring Boot Actuator, make sure you have the starter available as a dependency:
Then, enable the Thread Dump endpoint, include the following in the application.properties file:
management.endpoints.web.exposure.include=threaddump
Next, you can request a Thread Dump by fetching the following URL
curl http://localhost:8080/actuator/threaddump
Since the output is in JSON format, you might want to format it and maybe store it locally as follows:
curl http://localhost:8080/actuator/threaddump | jq > dump.json
Analyzing the Thread Dump in JSON format
In general terms, the format of a Thread Dump, is a simple text format which contains the Stack Trace for all running threads. In this article we provide a step-by-step guide on how to analyze a thread dump: How to inspect a Thread Dump
However, not all tools are capable to inspect a Thread Dump in JSON format. One that is able to is https://fastthread.io.
For example, here we have uploaded a Thread Dump in JSON format created by Spring Boot Actuator:
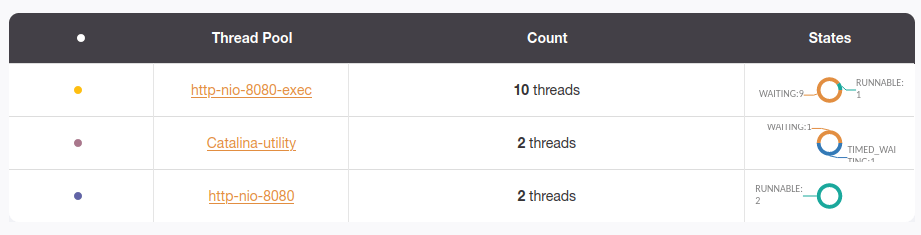
In general terms, the most common use case for generating thread dumps in JSON format is modern monitoring and diagnostic setups. Some use cases include:
Prometheus Monitoring:
- Prometheus Integration: Prometheus, a popular monitoring system, supports custom metrics scraping via its
/metricsendpoint. Using Spring Boot Actuator’s JSON thread dump endpoint (/actuator/threaddump), Prometheus can scrape and ingest thread dump information in JSON format.
Automated Health Checks and Analysis:
- Automated Diagnostics: JSON thread dumps can be fetched periodically or upon specific triggers. Automated processes can analyze these dumps, looking for patterns or anomalies that might indicate issues or performance bottlenecks.
Conclusion
Spring Boot Actuator simplifies the collection of thread dumps, offering valuable insights into your application’s thread activity. While the JSON format provided by Actuator is suitable for machine processing, converting it to a standard thread dump format can aid in human analysis and compatibility with various diagnostic tools. Leveraging Actuator’s thread dump endpoint alongside conversion options enhances the efficiency of performance analysis and issue resolution in Java applications.
Found the article helpful? if so please follow us on Socials


