Spring Boot Actuator is a powerful module that enables monitoring and managing Spring Boot applications effortlessly. In this tutorial, we’ll walk through the fundamentals of Spring Boot 3 Actuator, from installation to understanding its essential endpoints.
What is Spring Boot Actuator ?
Spring Boot Actuator serves as a set of production-ready features designed to help monitor and manage Spring Boot applications. It offers built-in endpoints and functionalities for collecting metrics, monitoring application health, accessing application-specific information, and more. Actuator acts as a handy toolkit providing valuable insights into the internal workings of your Spring Boot application.
Spring Boot Actuator Starter
In order to kick-start the Spring Boot Actuator it is sufficient to include the spring-boot-starter-actuator to autoconfigure the Actuator. You can then take advantage of Actuator’s features in order to monitor a Spring Boot application.
From Spring Boot CLI:
$ spring init -dweb,actuator actuator-demo
Or from the Spring Boot Initializr:
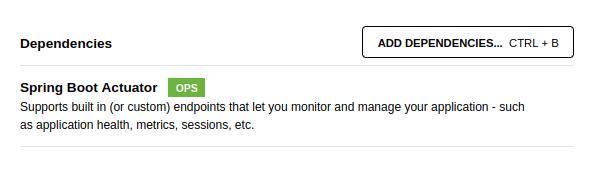
Here is the starter for Spring Boot Actuator:
<dependency>
	<groupId>org.springframework.boot</groupId>
	<artifactId>spring-boot-starter-actuator</artifactId>
</dependency>
Now if you run the entry point class, you can check the metrics available:
./mvnw spring-boot:run
The list of available Spring Boot 3 Actuator Endpoints is available at:
curl http://localhost:8080/actuator
As you can see from the output, in Spring Boot 3, only the /health Endpoint is available by default:
{
   "_links":{
      "self":{
         "href":"http://localhost:8080/actuator",
         "templated":false
      },
      "health":{
         "href":"http://localhost:8080/actuator/health",
         "templated":false
      },
      "health-path":{
         "href":"http://localhost:8080/actuator/health/{*path}",
         "templated":true
      }
   }
}
For example, to query just the /health endpoint, you can request it as follows:
$ curl http://localhost:8080/actuator/health
{"status":"UP"}
Spring Boot Actuator Endpoints
Spring Boot Actuator provides various endpoints accessible through HTTP or JMX, offering valuable insights into your application’s health, metrics, configurations, and more. Some essential endpoints include:
/actuator/health: Offers information about the application’s health status, providing details about dependencies, database connections, etc./actuator/info: Presents custom application information, offering a snapshot of the application’s details./actuator/metrics: Provides a wide array of metrics about different aspects of the application, such as JVM memory usage, HTTP request metrics, etc./actuator/auditevents: Offers access to audit events information like authentication success/failure, etc./actuator/env: Displays application environment details like properties, variables, and their respective values.
To access these endpoints:
- Firstly, make sure the Endpoint is enabled either by default or in the configuration (see next section for more info).
- Include the Context of the endpoint in the Web Context. For example
http://localhost:8080/actuator/info
How to enable additional Acutator endpoints
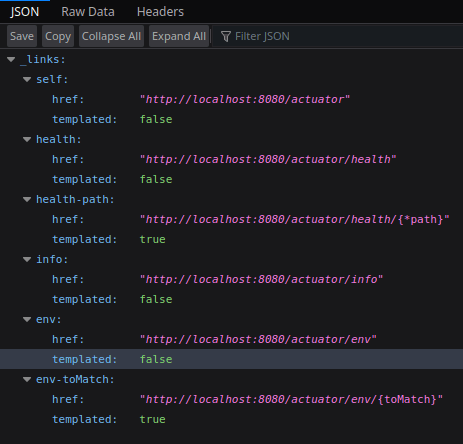
In order to enable all the available Actuator endpoints you have to set them through the property management.endpoints.web.exposure.include. For example, here is how to include the health, info and env Actuator Endpoint:
management.endpoints.web.exposure.include=health,info,env
Here is the list of available Actuator Endpoints after you start the Spring Boot application:
Finally, please note that you can also enable all Spring Boot Actuator Endpoints as follows:
management.endpoints.web.exposure.include=*
The above configuration in Yaml format would be:
management:
    endpoints:
        web:
            exposure:
                include: '*'
Finally, please note that you can also exclude one Endpoint from the full list. For example, to expose all enabled endpoints except one (for example /env), we use:
management.endpoints.web.exposure.include=*
management.endpoints.web.exposure.exclude=env
Navigating through the Endpoints
Navigating through Actuator endpoints involves accessing different endpoints through HTTP requests. Here’s how you might access the /actuator/metrics/tomcat.sessions.active.max endpoint:
Open a web browser or a tool like cURL or Postman and send an HTTP GET request to:
http://localhost:8080/actuator/metrics/tomcat.sessions.active.max
The response will be in JSON format and will contain the requested metric value, specifically tomcat.sessions.active.max. For example:
{
  "name": "tomcat.sessions.active.max",
  "baseUnit": "sessions",
  "measurements": [
    {
      "statistic": "VALUE",
      "value": 6.0
    }
  ],
  "availableTags": []
}
In this response, the value field under measurements indicates the maximum number of active sessions in the Tomcat server.
Conclusion
This beginner-friendly guide serves as an introduction to Spring Boot 3 Actuator, outlining its importance, installation process, and essential endpoints. Incorporating Actuator empowers developers to monitor and manage their Spring Boot applications efficiently, gaining valuable insights into their application’s behavior and performance.
Found the article helpful? if so please follow us on Socials


